在机器学习中,性能测量是一项必不可少的任务。因此,当涉及分类问题时,我们可以使用 AUC – ROC 曲线。当我们需要检查或可视化多类分类问题的性能时,我们会使用 AUC(Area Under the Receiver Operating Characteristics)-ROC(eceiver Operating Characteristics)曲线。它是检查任何分类模型性能的最重要评价指标之一。它也被写成 AUROC
本文回答以下问题:
1. What is the AUC – ROC Curve?
2. Defining terms used in AUC and ROC Curve.
3. How to speculate the performance of the model?
4. Relation between Sensitivity, Specificity, FPR, and Threshold.
5. How to use AUC – ROC curve for the multiclass model?
What is the AUC – ROC Curve?
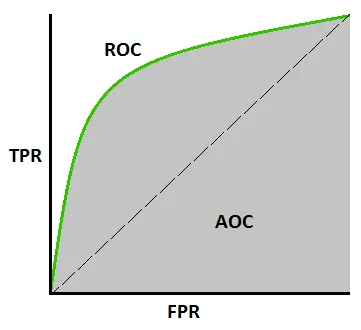
AUC – ROC curve is a performance measurement for the classification problems at various threshold settings. ROC is a probability curve and AUC represents the degree or measure of separability. It tells how much the model is capable of distinguishing between classes. Higher the AUC, the better the model is at predicting 0 classes as 0 and 1 classes as 1. By analogy, the Higher the AUC, the better the model is at distinguishing between patients with the disease and no disease.
The ROC curve is plotted with TPR against the FPR where TPR is on the y-axis and FPR is on the x-axis.

Defining terms used in AUC and ROC Curve.
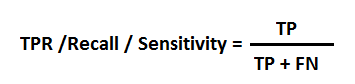
TPR (True Positive Rate) / Recall /Sensitivity
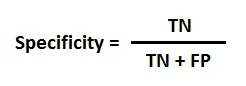
Specificity
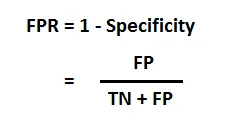
FPR
How to speculate about the performance of the model?
An excellent model has AUC near to the 1 which means it has a good measure of separability. A poor model has an AUC near 0 which means it has the worst measure of separability. In fact, it means it is reciprocating the result. It is predicting 0s as 1s and 1s as 0s. And when AUC is 0.5, it means the model has no class separation capacity whatsoever.
Let’s interpret the above statements.
As we know, ROC is a curve of probability. So let’s plot the distributions of those probabilities:
Note: Red distribution curve is of the positive class (patients with disease) and the green distribution curve is of the negative class(patients with no disease).
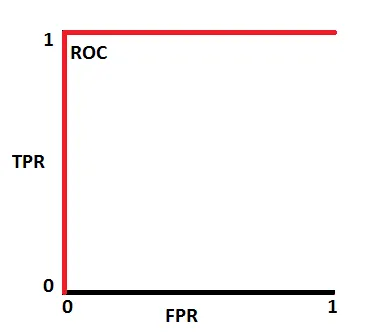
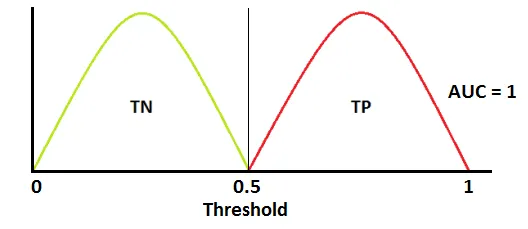
This is an ideal situation. When two curves don’t overlap at all means model has an ideal measure of separability. It is perfectly able to distinguish between positive class and negative class.
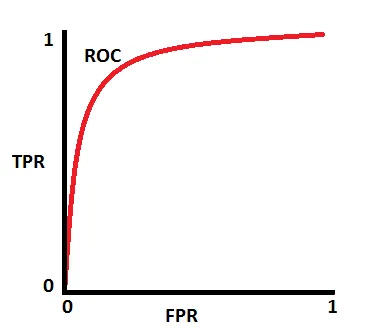
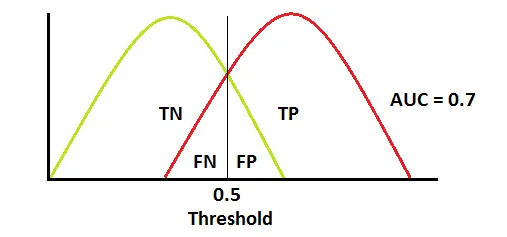
When two distributions overlap, we introduce type 1 and type 2 errors. Depending upon the threshold, we can minimize or maximize them. When AUC is 0.7, it means there is a 70% chance that the model will be able to distinguish between positive class and negative class.
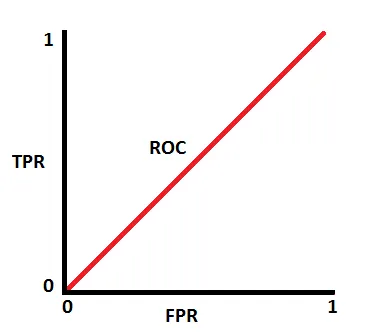
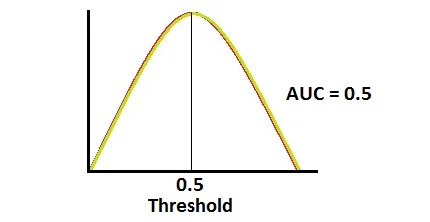
This is the worst situation. When AUC is approximately 0.5, the model has no discrimination capacity to distinguish between positive class and negative class.
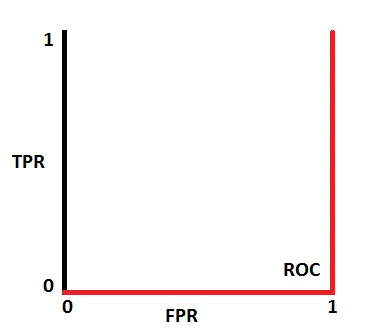
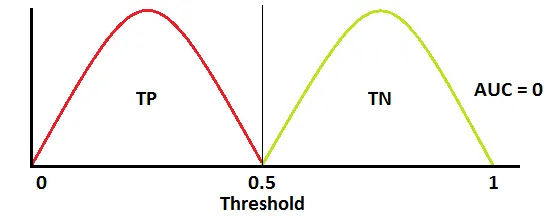
When AUC is approximately 0, the model is actually reciprocating the classes. It means the model is predicting a negative class as a positive class and vice versa.
The relation between Sensitivity, Specificity, FPR, and Threshold.
Sensitivity and Specificity are inversely proportional to each other. So when we increase Sensitivity, Specificity decreases, and vice versa.
Sensitivity⬆️, Specificity⬇️ and Sensitivity⬇️, Specificity⬆️
When we decrease the threshold, we get more positive values thus it increases the sensitivity and decreasing the specificity.
Similarly, when we increase the threshold, we get more negative values thus we get higher specificity and lower sensitivity.
As we know FPR is 1 – specificity. So when we increase TPR, FPR also increases and vice versa.
TPR⬆️, FPR⬆️ and TPR⬇️, FPR⬇️
How to use the AUC ROC curve for the multi-class model?
In a multi-class model, we can plot the N number of AUC ROC Curves for N number classes using the One vs ALL methodology. So for example, If you have three classes named X, Y, and Z, you will have one ROC for X classified against Y and Z, another ROC for Y classified against X and Z, and the third one of Z classified against Y and X.
如若转载,请注明出处:https://www.ouq.net/auc%e5%88%86%e6%9e%90%e5%92%8croc-curve%e8%a7%a3%e8%af%bb.html
 微信打赏,为服务器增加50M流量
  支付宝打赏,为服务器增加50M流量