Optimized protocol for stable isotope tracing and steady-state metabolomics in mouse HER2+ breast cancer brain metastasis
Open Access • DOI: 10.1016/j.xpro.2022.101345
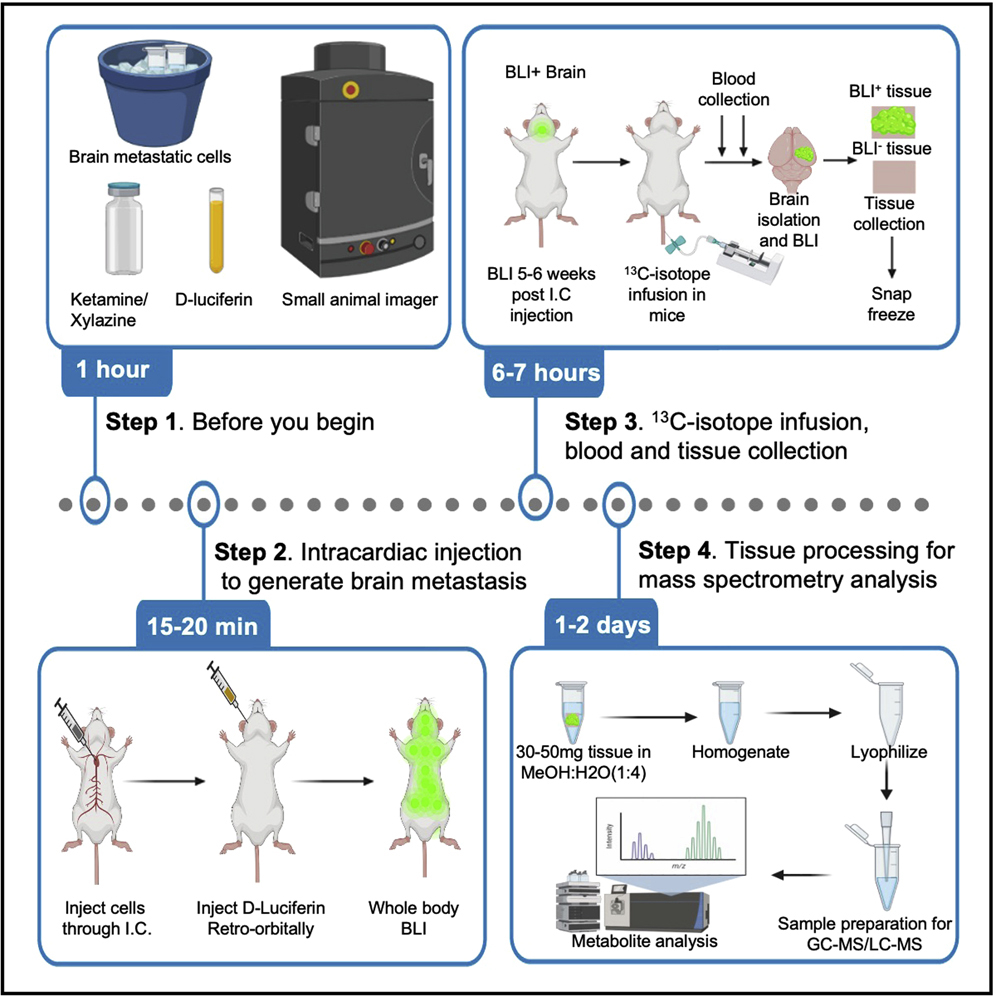
分析肿瘤细胞的代谢依赖性对癌症诊断和治疗至关重要。在此,我们描述了在小鼠HER2+乳腺癌脑转移病灶中进行13C稳定的葡萄糖和谷氨酰胺同位素追踪的方案。我们描述了如何在心内注射癌细胞以产生小鼠的脑转移病灶。然后,我们详细介绍了如何在已建立脑转移的小鼠中进行13C稳定同位素输注。最后,我们概述了样品收集、代谢物提取处理和质谱数据分析的步骤。

Before you begin
在转移过程中,肿瘤细胞会进行代谢适应,以在循环和远端器官中生存(Faubert等,2020;Hanahan和Weinberg,2011;Parida等,2022;Pavlova和Tompson,2016)。了解远端器官中转移细胞的代谢适应性可能会提供一些见解,为疾病的临床管理提供信息,并帮助开发新的诊断和治疗策略。
通过在心内注射GFP-荧光素酶标记的肿瘤细胞,并通过生物发光(BLI)成像追踪,可以在小鼠体内启动转移。我们分享一个优化的协议来检查稳态代谢组学,在脑转移病灶中进行13C稳定的葡萄糖和谷氨酰胺同位素灌注和追踪。在这里,我们使用已建立的HER2+乳腺癌脑转移模型,然而人们可以开发或使用其他已建立的癌症转移模型,并在脑部或其他转移病灶进行类似的分析。
下面的协议描述了如何准备和注射细胞以建立脑转移,进行13C稳定的葡萄糖和谷氨酰胺同位素输注和追踪,收集和处理样品进行质谱分析,分析和解释数据。
Cell preparation
Timing: Approximately 30–40 min
- Culture GFP-Luciferase positive human breast cancer brain metastatic cells in 10 cm dish up to 70%–80% confluency.
Note: Don’t grow cells to 100% confluency as it results in reduced viability and alters proliferation rate.
- Detach cells by adding 1 mL trypsin-EDTA solution (0.25%) to the plate. Keep plates at 37°C for 2–3 min.
- Stop trypsinization by adding 4 mL of 10% FBS containing ice-cold culture media.
- Collect media with detached cells in 15 mL conical tubes.
- Centrifuge tubes at 600 g for 3 min at 4°C and discard supernatant.
- Resuspend cells in 5 mL ice-cold 1× PBS and centrifuge at 600 g for 3 min at 4°C.
- Aspirate PBS and resuspend cells in 2–3 mL of ice-cold PBS. Count viable cells using trypan blue exclusion method and resuspend 0.5–1.0 × 10⁶ viable cells in 1 mL ice-cold PBS and keep on ice. See troubleshooting 1.
Critical: Resuspending cells in ice-cold PBS prevents cell clumping. Getting single cell suspension prior to injection is important, cell clumping could result in embolism and mouse death. Plan number of cells needed depending on the number of mice used for injections. For each mice inject 0.5–1.0 × 10⁵ cells in 100 μL. Optimization of cell number might be needed depending on the aggressiveness of the metastatic models.
Preparation of biosafety hood and animal imager
Timing: Approximately 10–15 min
- Clean biosafety hood, heat pad, small animal imager and nose cones with 70% ethanol.
- Turn heat pad on and set temperature to 37°C.
- Following aseptic practices, place Webcol (70% isopropyl prep pads), 1 mL pipette, 1 mL tips, one or 2 solid plastic platform, syringes with needle, cells on ice, terpene pen and cut pieces of paper tape into the hood.
Key resources table
| REAGENTS or RESOURCE | SOURCE | IDENTIFIER |
| Chemicals, peptides, and recombinant proteins | ||
| RPMI-1640 | Sigma-Aldrich | Cat# R8758 |
| Penicillin-Streptomycin | Sigma-Aldrich | Cat# P0781 |
| L-Glutamine | Sigma-Aldrich | Cat# G7513 |
| D- (+) Glucose | Sigma-Aldrich | Cat# G8270 |
| Trypsin-EDTA solution (0.25%) | Sigma-Aldrich | Cat#T4049 |
| Phosphate buffer saline (PBS) | Sigma-Aldrich | Cat# D8537 |
| Sodium chloride | Sigma-Aldrich | Cat#S9888 |
| Molecular biology grade water | Sigma-Aldrich | Cat#W4502 |
| Ketamine | MilliporeSigma | Cat#1356009 |
| Xylazine | MilliporeSigma | Cat#1720429 |
| Isoflurane | Covetrus | Cat#029405 |
| D-Luciferin potassium salt | Gold Biotechnology | Cat#LUCK-5G |
| Acetonitrile | Sigma-Aldrich | Cat# 1000291000 |
| Formic acid | Sigma-Aldrich | Cat#00940 |
| Anhydrous pyridine | Sigma-Aldrich | Cat# 270970 |
| N-(tert-butyldimethylsilyl)-N-methyltrifluoroacetamide | Sigma-Aldrich | Cat# 394882 |
| Methanol, Optima™ LC/MS Grade | Thermo Fisher scientific | Cat#A456 |
| Methoxyamine | Sigma-Aldrich | Cat#226904 |
| Trypan blue 0.4% stain | Thermo Fisher scientific | Cat#T10282 |
| D-Glucose (13C6) | Cambridge Isotope lab. | Cat# CLM-1396 |
| Glutamine (13C5) | Cambridge Isotope lab. | Cat# CLM-184161-19 |
| Experimental models: Organisms/strains | ||
| Female Mouse: Hsd Athymic nude mice-Foxn1nu(4–5 weeks) | Envigo | Cat#069 |
| Female Mouse: NOD.Cg-Prkdcscid Il2rgtm1Wjl/SzJ (4–5 weeks) | The Jackson Laboratory | Cat#005557 |
| Software and algorithms | ||
| Aura | Spectral instrument imaging | https://spectralinvivo.com |
| Biorender | BioRender | https://biorender.com |
| Profinder software | Agilent Technologies | https://www.agilent.com |
| Maven | Maven | https://resources.elucidata.io/elmaven |
| Other | ||
| Programmable Syringe Pump | Southpointe surgical supply | Cat#NE1800 |
| Gas chromatography System | Agilent technologies | Cat#7890B |
| Small animal imager | Spectral Instrument imaging | Cat#AMI-HTX |
| iFunnel Q-TOF mass spectrometer | Agilent technologies | Cat#6550 |
| Tissueruptor II | QIAGEN | Cat#9002755 |
| Speed vac | Thermo Fisher scientific | Cat#SPD120 |
| Tuberculin syringe | BD Biosciences | Cat#309625 |
| Insulin syringe | BD Biosciences | Cat#329461 |
| 10 mL syringe | BD Biosciences | Cat#302995 |
| 20 mL syringe | BD Biosciences | Cat#302830 |
| Scalp vein set 20G | Exelint international | Cat#26703 |
| Scalp vein set 23G | Exelint international | Cat#26706 |
| Webcol alcohol prep | Covidien | Cat#5110 |
| EDTA tube | Thermo Fisher scientific | Cat#NC9414041 |
| 0.22-micron syringe filter | Thermo Fisher scientific | Cat#723-2520 |
Materials and equipment
Ketamine (25 mg/mL)/Xylazine (2.5 mg/mL) cocktail
| Reagent | Final concentration | Amount |
| Ketamine 100 mg/mL in water | 25 mg/mL | 2.5 mL |
| Xylazine 10 mg/mL in water | 2.5 mg/mL | 2.5 mL |
| 1.8% saline | 0.9% | 5 mL |
| Total | n/a | 10 mL |
Note: Approval from institute animal ethics committee is needed to prepare this solution. Do not store for more than 1 month at 20°C–22°C.
D-luciferin potassium salt solution (50 mM)
Dissolve 1 g of D-luciferin potassium salt in 62.81 mL of 1× PBS to get a final concentration of 50 mM.
Note: Make aliquots and store at −20°C. Can be used for months, avoid multiple freeze-thaws.
D-Glucose (13C6) solution (100 mg/mL)
| Reagent | Final concentration | Amount |
| D-Glucose (13C6) | 100 mg/mL | 1 g |
| Molecular Biology grade water | n/a | 5 mL |
| 1.8% saline | 0.9% | 5 mL |
| Total | n/a | 10 mL |
Note: Prepare glucose solution using molecular biology grade water and 1.8% saline in 1:1 ratio. Filter it using 0.22-micron syringe filter. Make it fresh, do not store.
L-Glutamine (13C5) solution (35 mg/mL)
| Reagent | Final concentration | Amount |
| L-Glutamine (13C5) | 35 mg/mL | 1 g |
| Mol. Bio. grade water | n/a | 5 mL |
| 1.8% saline | 0.9% | 5 mL |
| Total | n/a | 10 mL |
Note: Prepare L-Glutamine (13C5) solution using molecular biology grade water and 1.8% saline in 1:1 ratio. Filter it using 0.22-micron syringe filter. Make it fresh, do not store.
80:20 methanol: Water solution
Prepare 100 mL of 80:20 Methanol: Water by adding 20 mL water to 80 mL methanol.
Note: Solution can be stored for 1 month at −80°C.
Step-by-step method details
Intracardiac injections to generate brain metastasis in mice
Timing: Approximately 15–20 min per mouse
- Anesthetize 5–6 weeks old female athymic Nude Foxn1nu or NSG mice by injecting intraperitoneally 50 μL of Ketamine (25 mg/mL)/Xylazine (2.5 mg/mL) cocktail. See troubleshooting 1.
Note: In our experience, 50 μL of Ketamine/Xylazine cocktail is well tolerated by mice during intraperitoneal injection. If needed 100 μL of Ketamine/Xylazine cocktail can be administered to induce sleep and loss of toe pinch response.
- For mice with fur, shave hair in the chest area using hair trimmer or remove hair using hair removal cream to identify injection point and obtain better bioluminescent images.
Note: In our hands, compared to shaving, hair removal cream is more effective and faster.
- Post anesthesia, put the mouse on its back with chest facing up on a flat surface and stretch forelimbs and hind limbs and restrict any movement using paper tape (Figure 1).
Critical: Be careful not to over stretch the animal as it could physically injure the animal.
- Wipe the chest using Webcol and mark the injection spot targeting left ventricle (the front and middle of the chest, slightly left of the sternum between sternal notch and top of xiphoid process, (Figure 1).
- Draw 100 μL of cells into 26G tuberculin syringe slip tip with intradermal bevel needle. Create an air space between plunger and meniscus to see cardiac pulse.
Note: Mix cells in Eppendorf tube using 1 mL pipette before drawing cells into syringe. This process helps uniform distribution of cells and prevents clumping.
- Hold the syringe upright and insert needle in the marked spot and check for the blood flow into the syringe. Press the plunge slowly and inject cells into the heart. See troubleshooting 2.
Note: To avoid heart puncture, remove the needle in straight position.
- Remove the tape and let the mouse recover on heat pad for 5 min.
- Retro-orbitally inject 100 μL of 50 mM D-luciferin.
- Check the distribution of cells by BLI imaging with exposure time of 30–60 s.
Note: Uniform BLI signal should be detected throughout the mice body (Figure 2).
Weekly bioluminescence imaging (BLI) analysis to assess metastatic progression
Timing: Approximately 5–10 min per mouse
Measure metastatic incidence using BLI imaging every week or every two weeks.
- Anesthetize animals using isoflurane in anesthesia induction chamber. Plan number of animals to anesthetize depending on the capacity of the imaging system and the anesthesia chamber.
Note: Animals can be anesthetized using ketamine/xylazine solution as described earlier. However, frequent use of ketamine/xylazine can impact animal health.
- Post anesthesia, inject 100 μL of D-luciferin through retro-orbital sinus.
- Place mice nose into the nose cone of the imaging system platform.
- Obtain BLI image with exposure time of 30–60 s. Look for signal in brain or organ of interest. If signal is saturated, reduce exposure time.
Note: For tracking weekly metastatic progression using BLI signal, keep exposure time constant.
- Determine whole body average photon flux and brain only photon flux using image analysis software. Mice are ready for isotope tracing once the average brain only or whole-body radiance is more than 106 p/sec/cm2/sr.
Note: Brain metastatic lesions are usually observed 5–6 weeks post-intracardiac injection.
Isotope infusion in mice with brain metastatic lesions
Timing: Approximately 6–7 h per mouse
- Preparing mice for 13C-glucose and glutamine infusion.
- Fast mice 12–16 h for 13C-glucose and 13C-glutamine infusion. Fasting mice results in higher fractional enrichment of 13C-glucose in plasma. However, 13C-glutamine infusion can be done in mice without fasting.
- Note: We observed no significant differences in fractional enrichment of glutamine in plasma upon fasting.
- Anesthetize mice by injecting intraperitoneally 30 mg/mL of ketamine/xylazine (50 μL) and later with 20 mg/mL of ketamine hydrochloride (50 μL).
- Place a 20-gauge catheter in the lateral tail vein of each anesthetized mouse.
- 13C6-glucose infusion in mice.
- For glucose tracing, infuse 13C6-glucose intravenously as a bolus of 0.6 mg/g body mass over 1 min in 150 μL of saline using a programmable multi syringe holding pump system.
- Next, infuse bolus of 0.0138 mg/g body mass per minute for 3–4 h (in a volume of 150–200 μL/h) using same procedure (Figure 2). See troubleshooting 3.
- 13C5-glutamine infusion in mice.
- For glutamine tracing, infuse 13C5-glutamine as a bolus of 0.2125 mg/g body mass over 1 min in 150 μL of saline.
- Next, infuse bolus of 0.004 mg/g body mass per minute for 5–6 h (in a volume of 150–200 μL/h) using a programmable multi syringe holding pump system. See troubleshooting 3.
Note: Monitor mice continuously throughout the infusion experiment (3 h for glucose infusion, and 5 h for glutamine infusion).
Critical: Fasted mice should be hydrated enough and must be kept on warm pad throughout the time of experiment.
- To determine fractional enrichment of 13C-labeled metabolite in plasma over the course of infusion, collect blood every hour by retro-orbital puncture into an EDTA tube. Label and keep the tubes on ice.
Critical: If mice appear weak, blood can be collected once every two hours.
Note: Sodium heparin or Sodium citrate tubes can be used for this process.
- Post infusion, inject 100 μL of D-luciferin through retro-orbital sinus and obtain bioluminescent image to locate brain metastatic lesion.
Note: Prior to intracardial perfusion, D-luciferin injection is critical to detect brain metastatic lesion ex vivo.
- Perform intracardial perfusion using 15–20 mL of 1× PBS in syringe connected to 23G butterfly needle.
- Post perfusion, isolate the brain carefully by removing the skull and obtain ex vivo brain bioluminescent image using IVIS machine. Identify metastatic lesion using BLI signal.
Collect and process brain metastatic lesions for metabolite analysis
Timing: Approximately 1–2 h
Note: Metastatic lesions from several mice (n≅5) need to be analyzed to increase robustness and account for variability.
- Based on the observed signal approximate the region of metastatic lesion in the brain. Resect BLI+ brain metastatic lesion using surgical blades and verify BLI signal in the resected metastatic lesion using IVIS imager. See troubleshooting 4.
Critical: The isolated BLI positive tissue is likely to contain primarily tumor cells along with few brain resident cells. Minimize number of non-tumor cells in the collected tissue by precisely cutting only regions with high BLI signal. As controls pick BLI negative region within the brain and from the same region in mice with no brain metastasis.
- Flash freeze collected tissues in liquid nitrogen and store at −80°C.
- Homogenize 30–50 mg of metastatic lesion using an electronic tissue disruptor (Qiagen) in 1 mL chilled 80% methanol (LC-MS grade, Fisher Scientific). See .
Note: A minimum of 15 mg of tissue is required for further processing.
- Subject the homogenized solution three freeze-thaw cycles using liquid nitrogen and 37°C water bath.
- Centrifuge samples at 13,000 g for 10 min to precipitate macromolecules.
- Collect supernatant carefully and lyophilize using Speed-Vac
- Figure 3. Schematic illustration showing metabolite extraction and analysis procedures
Process blood samples for metabolite analysis
Timing: Approximately 1 h
- Blood samples stored on ice were centrifuged at 2,500 g at 4°C for 10 min.
Note: This is a time sensitive process, do not store blood samples on ice for more than an hour.
- Collect blood plasma (top yellow layer) carefully and freeze at −80°C.
- Add 10–15 μL of blood plasma to 80:20 methanol: water and subjected to evaporation using Speed-Vac.
In vivo steady-state metabolite profile in brain metastatic lesions
Timing: Approximately 60–70 min
- For in vivo steady state metabolite analysis, once the average brain only or whole-body photon flux reached 106–107p/sec/cm2/sr, mice were subjected to cardiac perfusion post D-luciferin injection and brain was isolated as described earlier.
- Use ex vivo brain BLI signal to mark and surgically remove metastatic lesions.
Note: The isolated BLI positive tissue is likely to contain primarily tumor cells along with few non-tumor cells. Minimize number of non-tumor cells in the collected tissue by selecting BLI high signal regions. As controls for normalization pick BLI negative region within the brain and from the same region in mice with no brain metastasis.
- Flash freeze tumors in liquid nitrogen and store at −80°C until further processing.
- Sample preparation for Mass spectroscopy.
- Homogenize metastatic lesions (30–50 mg) using an electronic tissue disruptor (Qiagen) in 1 mL chilled 80% methanol (LC-MS grade, Fisher Scientific).
- Next, follow three freeze-thaw cycles by using liquid nitrogen and a 37°C water bath.
- Centrifuge samples at 13,000 g for 10 min at 4°C.
- Collect supernatant and lyophilize using a Speed-Vac.
Gas chromatography mass spectrometry (GC-MS)
Timing: Approximately 60–70 min
- Resuspend lyophilized samples with 40–60 μL of anhydrous pyridine containing methoxyamine (10 mg/mL).
- Vortex the solution and add it to a pre-ready GC-MS autoinjector vial and heat at 70°C for 10 min.
- Next, add 80–120 μL N-(tert-butyldimethylsilyl)-N-methyltrifluoroacetamide (MTBSTFA) derivatization reagent to each vial, vortex to mix and heat vials at 70°C for 1 h.
- Post incubation, inject 1 μL of sample into Agilent 7890 gas chromatograph coupled to mass selective detector Agilent 5975C. See troubleshooting 6.
- Process the obtained raw data using maven software with in-house optimized database, and the natural abundance of 13C correction. Export files as spreadsheet (.csv).
Liquid chromatography-mass spectrometry (LC-MS)
Timing: Approximately 60–70 min
- Resuspend lyophilized samples in 100 μL 80:20 acetonitrile: water solution (HPLC grade). For steady state metabolite analysis, lyophilized samples can be resuspended in 100 μL of 0.1% formic acid in water and added to vials with pre-slit screw caps.
- Perform data acquisition using reverse-phase chromatography on a 1290 UHPLC liquid chromatography (LC) system interfaced to a high-resolution mass spectrometry (HRMS) 6550 iFunnel Q-TOF mass spectrometer (MS) (Agilent Technologies, CA).
- Operate MS in both positive and negative (ESI+ and ESI-) modes. Separate analytes using an Acquity UPLC® HSS T3 column (1.8 μm, 2.1 × 150 mm, Waters, MA).
- Keep the column at 20°C–22°C. Mobile phase A composition is 0.1% formic acid in water and mobile phase B composition is 0.1% formic acid in 100% acetonitrile (ACN).
- The LC gradient is 0 min: 1% B; 5 min: 5% B; 15 min: 99% B; 23 min: 99% B; 24 min: 1% B; 25 min: 1% B. The flow rate was 250 μL/min. Use 5 μL of sample for injection.
- Set ESI source conditions as follows: dry gas temperature 225°C and flow 18 L /minute, fragmentor voltage 175 V, sheath gas temperature 350°C and flow 12 L/min, nozzle voltage 500 V, and capillary voltage +3,500 V in positive mode and −3,500 V in negative.
- Set the instrument to acquire over the full m/z range of 40–1,700 in both modes, with the MS acquisition rate of 1 spectrum per sec in profile format.
- Process raw data files (.d) using Profinder B.08.00 SP3 software (Agilent Technologies, CA) with an in-house database created using same analysis conditions and determined retention time and accurate mass information on 600 standards from Mass Spectrometry Metabolite Library (IROA Technologies, MA).
- The in-house database matching parameters were mass tolerance 10 ppm; retention time tolerance 0.5 min. Peak integration result was manually curated in Profinder for improved consistency and exported as a spreadsheet (.csv).
- Next, to analyze the obtained data two different normalizations are necessary.
- Normalization to natural abundance of the isotope13C (1.109%).
- Normalization to infused isotope e.g., glucose or glutamine in blood plasma.
Expected outcomes
Glucose and glutamine are the most prominent sources of bioenergetics and biosynthesis in cancer cells . Glucose could be directed through glycolysis into TCA cycle, the pentose phosphate pathway, and several biomolecule synthesis pathways. Likewise, glutamine could undergo oxidative glutaminolysis or reductive decarboxylation and helps in synthesis of key cellular metabolites.
Through a phenotypic screen in mice, we isolated isogenic HER2+ synchronous (S-BM) and metachronous (M-BM) brain metastatic cells. By investigating these phenotypically distinct brain-tropic S-BM and M-BM cells, we uncovered the metabolic differences within these metastatic population using isotope tracing and steady state metabolite analysis. Isotope tracing revealed key differences in glucose and glutamine catabolism between S-BM and M-BM brain metastases. In metastatic lesions of similar size and comparable BLI signal intensity, no significant differences in glucose catabolism was observed between S-BM and M-BM (Figure 4A). However, a marked increase in labeling of the TCA intermediates succinate, malate, aspartate and citrate (M+4) from glutamine was observed in M-BM metastatic lesions compared to S-BM . Moreover, a significant increase in M+5/M+4 citrate ratio suggests reductive glutamine catabolism was predominant in S-BM lesions compared to M-BM lesions where oxidative carboxylation was predominant.
Figure 4. In vivo 13C6-glucose and 13C5-glutamine tracing in S-BM and M-BM metastatic lesions ¶ (A) 13C6-glucose tracing in brain metastatic lesions reveals enrichment of indicated metabolites. ¶ (B) Total labeling of indicated metabolites in brain metastatic lesions analyzed by mass spectrometry and normalized to enriched 13C5-glutamine. ¶ (C) M+5/M+4 citrate ratios highlighting reductive carboxylation of glutamine in S-BM and oxidative carboxylation in M-BM. ¶ Reprinted with permission from .
By comparing isotope tracing data along with steady-state metabolite profile one can start defining key biosynthetic pathways within metastatic tumor. Moreover, similar approach can be utilized to understand metabolic differences between tumor cells at the primary and metastatic sites. To further validate these findings, assessing expression of metabolic enzymes responsible of these altered nutrient utilization patterns and inhibiting their function either pharmacologically or by genetic modulation is needed.
These studies are likely to highlight differences between the glucose and glutamine utilization patterns in metastasis from tumor cells with distinct oncogenomic status or phenotypic traits. This protocol can be applied to other metastatic mouse models and adapted to optimize isotope labeled tracing of other energy substrates such as lactate, pyruvate, acetate and palmitate ; Nair and Malladi, 2019). Defining metabolic state and flux within metastatic lesions associated with genomic and phenotypic differences are likely to provide novel insights that can be further exploited to diagnose and treat metastasis.
Limitations
13C-tracing experiments described here demonstrate carbon enrichment into pathway of interest but do not provide detailed information on overall metabolic flux.
Despite high BLI signal, obtaining enough metastatic lesion (15 mg) for analysis can be a challenge. Likewise, vascularity of metastatic lesion presents a challenge, poor vascularity, less oxygen supply to tumor tissue can results in poor infusion and detection.
Identifying and defining metabolic state of micro-metastasis or few disseminated tumor cells remains a challenge at this time.
Loss of labile compounds during metabolite extraction and sample preparation for mass spectrometry analysis is a limitation.
Troubleshooting
Problem 1
Mice death post intracardiac injection.before you begin step 7 and step-by-step method details step 1).
Potential solution
- Cell clumping during injection can cause embolism in mice, which can lead to animal mortality. Resuspending single cell suspension in ice-cold PBS and storing on ice prevents cell clumping.
- High dose of Ketamine/Xylazine can cause cardiovascular and respiratory depression, and anomaly in heartbeat patterns, which can lead to animal mortality. Thus, optimization of Ketamine/Xylazine cocktail is required.
- In our hands, 50 μL of low dose mouse Ketamine (25 mg/mL)/ Xylazine (2.5 mg/mL) cocktail produces minimal mortality in athymic and NSG mice. Mice can tolerate up to 100 μL of this combination.
Problem 2
Luciferase signal in lungs – Failure of intracardiac injection. (step-by-step method details step 6).
Potential solution
- One can use ultrasound as a guide to perform intracardiac injection.
- Don’t push the needle deep into the chest area that it may pierce through the heart.
Problem 3
Low enrichment of tracer in blood plasma and tumor tissue. (step-by-step method details steps 16 and 17).
Potential solution
Increase the concentration of the metabolite by 5%–10% and/or infusion time.
Problem 4
No luciferase signal in resected metastatic lesion. (step-by-step method details step 22).
Potential solution
This might be due imprecise selection for metastatic lesion or loss of luciferase signal.
- Image resected region along with the remaining brain to confirm isolation of BLI positive metastatic lesion.
- Luciferase signal remains stable for approximately 20–25 min. So, one should aim to perform perfusion, brain isolation, BLI imaging, metastatic lesion collection and conformation within 20–25 min.
Problem 5
Not enough metastatic lesion for downstream analysis. (step-by-step method details step 24).
Potential solution
Metastatic lesions with average radiance of 106 p/sec/cm2/sr should provide enough material for mass spectrometry analysis. If not, consider combining multiple lesions from an animal.
Problem 6
Poor quality GC-MS data and hard to interpret. (step-by-step method details step 38).
Potential solution
- If the GC-MS data peaks are too small to confidently interpret, inject more sample (3 μL, instead of 1 μL) into the GC-MS.
- If the GC-MS data has a large contaminating peak, it is likely to be from phosphates. It is important to never wash the tumor tissue with PBS.
如若转载,请注明出处:https://www.ouq.net/%e5%b0%8f%e9%bc%a0her2%e4%b9%b3%e8%85%ba%e7%99%8c%e8%84%91%e8%bd%ac%e7%a7%bb%e7%9a%84%e7%a8%b3%e5%ae%9a%e5%90%8c%e4%bd%8d%e7%b4%a0%e8%bf%bd%e8%b8%aa%e5%92%8c%e7%a8%b3%e6%80%81%e4%bb%a3%e8%b0%a2.html
 微信打赏,为服务器增加50M流量
  支付宝打赏,为服务器增加50M流量